Market Outlook
August 23, 2017
Market Cues
Domestic Indices
Chg (%)
(Pts)
(Close)
Indian markets are likely to open Positive tracking global cues and SGX Nifty.
BSE Sensex
0.1
33
31,292
U.S. stocks closed higher Tuesday, with Dow and NASDAQ turning in their best
Nifty
0.1
11
9,766
session in the months. The upward movement supported by technology shares and
Mid Cap
(0.4)
(62)
14,926
health care stocks. Further, rally pushed up after a report from politico said Trupms
Small Cap
(0.5)
(79)
15,389
top aides and congressional leaders have made significant strides in shaping a tax
Bankex
0.2
54
27,079
overhaul.
The Dow advanced 0.9 percent to 21,899, the NASDAQ surged up 1.4 percent to
Global Indices
Chg (%)
(Pts)
(Close)
6,297 and the S&P 500 jumped 1 percent to 2,452.
Dow Jones
0.9
196
21,900
U.K. stocks snapped a three-session losing streak Tuesday, bolstered by gains for
Nasdaq
1.4
84
6297
miners and home builder Persimmon PLC after well-received financial updates. The
FTSE
0.9
64
7,382
FTSE 100 UKX, rose 0.9% to close at 7,381, logging its biggest one-day percentage
Nikkei
(0.0)
(9)
19,384
gain since July 12.
Hang Seng
0.9
247
27,402
On domestic front, indices could not carry initial upward momentum and ended a
Shanghai Com
0.1
3
3,290
range bound session marginally higher. The indices supported by somewhat eased
Tension on Korean peninsula and investors looked ahead to the upcoming Jackson
Hole central banking conference beginning on Thursday. The BSE Sensex ended the
Advances / Declines
BSE
NSE
session up 0.11 percent at 31,292 while the broader Nifty index edged up 0.11
Advances
1,887
1,542
percent to finish at 9766.
Declines
1,715
1,132
News Analysis
Unchanged
120
73
Bandhan Bank preparing to launch IPO
Volumes (` Cr)
Oriental Bank of Commerce plans to raise` 1,000Cr via Basel-III bonds
BSE
3,063
Detailed analysis is on Pg2
NSE
23,680
Investor’s Ready Reckoner
#Net Inflows (` Cr)
Net
Mtd
Ytd
Key Domestic & Global Indicators
(1,789)
(9,765)
48,631
FII
(565)
(2,249)
41,972
Stock Watch: Latest investment recommendations on 150+ stocks
63
10,828
61,774
Pg7 onwards
MFs
804
4,895
14,333
Top Picks
Top Gainers
Price (`)
Chg (%)
CMP
Target
Upside
Company
Sector
Rating
(`)
(`)
(%)
Hcl-Insys
147
9.4
Blue Star
Capital Goods
Accumulate
731
760
4.0
Fconsumer
44
5.7
Dewan Housing FinanceFinancials
Buy
456
520
14.1
Concor
1,277
4.4
Mahindra Lifespace
Real Estate
Buy
414
522
26.1
Apollohosp
1,098
4.3
Navkar Corporation
Others
Buy
183
265
44.7
KEI Industries
Capital Goods
Buy
221
258
16.6
Trent
281
4.2
More Top Picks on Pg5
Key Upcoming Events
Top Losers
Price (`)
Chg (%)
Previous
Consensus
Date
Region
Event Description
Religare
258
(9.6)
Reading
Expectations
Icil
100
(7.8)
Aug 23, 2017 Germany PMI Services
53.10
53.30
Aug 23, 2017 Germany PMI Manufacturing
58.10
57.60
Indhotel
111
(7.3)
Aug 23, 2017 US
New home sales
610.00
610.00
Recltd
153
(5.2)
Aug 23, 2017 Euro Zone Euro-Zone Consumer Confidence
(1.70)
(1.80)
Sintex
30
(5.1)
Aug 24, 2017 US
Initial Jobless claims
232.00
238.00
#as on 21th Aug, 2017
More Events on Pg7
Market Outlook
August 23, 2017
News Analysis
Bandhan Bank preparing to launch IPO
Bandhan Bank Ltd, one of the two entities to receive a universal banking licence in
2015 and the only microfinance institution to do so, has started preparing for an
initial public offering (IPO).
Kolkata-based Bandhan Bank has a network of 840 branches and 2,444 doorstep
service centres in 33 states and union territories. Announcing its quarterly results
last month, the bank said that its deposits have expanded 51% to `22,439cr at the
end of June. Cost of deposits has over the past year come down from 8.22% to
7.04%. The bank’s total outstanding loans stood at `21,389cr as of the end of
June.
Bandhan Bank counts Singapore’s sovereign wealth fund GIC, World Bank arm
International Finance Corp and Small Industries Development Bank of India as its
investors.
Oriental Bank of Commerce plans to raise ` 1,000Cr via Basel-III bonds
Public sector lender Oriental Bank of Commerce plans on Tuesday said it will raise
up to Rs 1,000 crore by issuing Basel III compliant bonds on private placement
basis. "The bank intends to raise tier I capital through private placement of Basel III
compliant additional tier I bonds of Rs 10 lakh each at par aggregating to Rs 500
crore,"
The proposed bond issue of the lender has been rated A (Hyb) with a negative
outlook by Icra, while CARE has rated it 'A' with negative outlook.
Basel III are the global standard banking grades which are being implemented to
mitigate the concerns on potential stresses on asset quality and consequential
impact on performance and profitability of banks. Bank
Economic and Political News
Defaulters owe 27% of total bad loans to SBI alone, PNB next
Rupee free fall continues, down 5 paise to 64.13 a dollar
Corporate News
RBI hikes foreign investment limit in Eris Life to 49% from existing 24%
SBI waives off up to 100% processing fee on car, gold, personal loans
Indo Count Industries Denies rejection of orders by any customers
DLF Board meet on August 25 to review the status of the proposed sale of
compulsorily convertible preference shares to GIC
Market Outlook
August 23, 2017
Top Picks
Market Cap
CMP
Target
Upside
Company
Rationale
(` Cr)
(`)
(`)
(%)
Strong growth in domestic business due to its leadership
in acute therapeutic segment. Alkem expects to launch
Alkem Laboratories
20,985
1,755
2,161
23.1
more products in USA, which bodes for its international
business.
We expect the company would report strong profitability
Asian Granito
1,228
408
480
17.6
owing to better product mix, higher B2C sales and
amalgamation synergy.
Favorable outlook for the AC industry to augur well for
Cooling products business which is out pacing the
Blue Star
6,998
731
760
4.0
market growth. EMPPAC division's profitability to improve
once operating environment turns around.
With a focus on the low and medium income (LMI)
consumer segment, the company has increased its
Dewan Housing Finance
14,292
456
520
14.1
presence in tier-II & III cities where the growth
opportunity is immense.
Loan growth is likely to pick up after a sluggish FY17.
Karur Vysya Bank
8,225
136
160
17.6
Lower credit cost will help in strong bottom-line growth.
Increasing share of CASA will help in NIM improvement.
High order book execution in EPC segment, rising B2C
KEI Industries
1,721
221
258
16.6
sales and higher exports to boost the revenues and
profitability
Speedier execution and speedier sales, strong revenue
Mahindra Lifespace
2,125
414
522
26.1
visibility in short-to-long run, attractive valuations
Expected to benefit from the lower capex requirement
Music Broadcast
2,094
367
434
18.3
and 15 year long radio broadcast licensing.
Massive capacity expansion along with rail advantage at
Navkar Corporation
2,612
183
265
44.7
ICD as well CFS augurs well for the company
Strong brands and distribution network would boost
Siyaram Silk Mills
1,832
1,954
2,500
27.9
growth going ahead. Stock currently trades at an
inexpensive valuation.
Market leadership in Hindi news genre and no.
2
viewership ranking in English news genre, exit from the
TV Today Network
1,444
242
344
42.1
radio business, and anticipated growth in ad spends by
corporates to benefit the stock.
After GST, the company is expected to see higher
volumes along with improving product mix. The Gujarat
Maruti Suzuki
2,26,513
7,498
8,544
13.9
plant will also enable higher operating leverage which
will be margin accretive.
Source: Company, Angel Research
Market Outlook
August 23, 2017
Key Upcoming Events
Global economic events release calendar
Bl oomberg Data
D ate
Time
C ountry
Event Description
Unit
Period
L ast Reporte d
E stimate d
Aug 23, 2017
1:00 PM Germany
PMI Services
Value
Aug P
53.10
53.30
1:00 PM Germany
PMI Manufacturing
Value
Aug P
58.10
57.60
7:30 PM US
New home sales
Thousands
Jul
610.00
610.00
7:30 PM Euro Zone
Euro-Zone Consumer Confidence
Value
Aug A
(1.70)
(1.80)
Aug 24, 2017
6:00 PM US
Initial Jobless claims
Thousands
Aug 19
232.00
238.00
11: 30 AM Germany
GDP nsa (YoY)
% Change
2Q F
0.80
0.80
2:00 PM UK
GDP (YoY)
% Change
2Q P
1.70
1.70
Aug 25, 2017
7:30 PM US
Existing home sales
Million
Jul
5.52
5.55
Aug 29, 2017
7:30 PM US
Consumer Confidence
S.A./ 1985=100
Aug
121.10
119.00
Aug 30, 2017
6:00 PM US
GDP Qoq (Annualise d)
% Change
2Q S
2.60
2.70
Aug 31, 2017
1:25 PM Germany
Unempl oyment change (000's)
Thousands
Aug
(8.00)
6:30 AM China
PMI Manufacturing
Value
Aug
51.40
51.20
Sep 01, 2017
6:00 PM US
Change in N onfarm payrolls
Thousands
Aug
209.00
180.00
6:00 PM US
Unnemployment rate
%
Aug
4.30
4.30
2:00 PM UK
PMI Manufacturing
Value
Aug
55.10
Sep 05, 2017
2:30 PM Euro Zone
Euro-Zone GDP s.a. (QoQ)
% Change
2Q F
0.60
Sep 07, 2017
5:15 PM Euro Zone
ECB announces interest rates
%
Sep 7
-
Sep 08, 2017
India
Exports YoY%
% Change
Aug
3.94
India
Imports YoY%
% Change
Aug
15.40
2:00 PM UK
Industrial Production (YoY)
% Change
Jul
0.30
China
Exports YoY%
% Change
Aug
7.20
Sep 09, 2017
7:00 AM China
Consumer Price Index (YoY)
% Change
Aug
1.40
Sep 12, 2017
2:00 PM UK
CPI (YoY)
% Change
Aug
2.60
Source: Bloomberg, Angel Research
Market Outlook
August 23, 2017
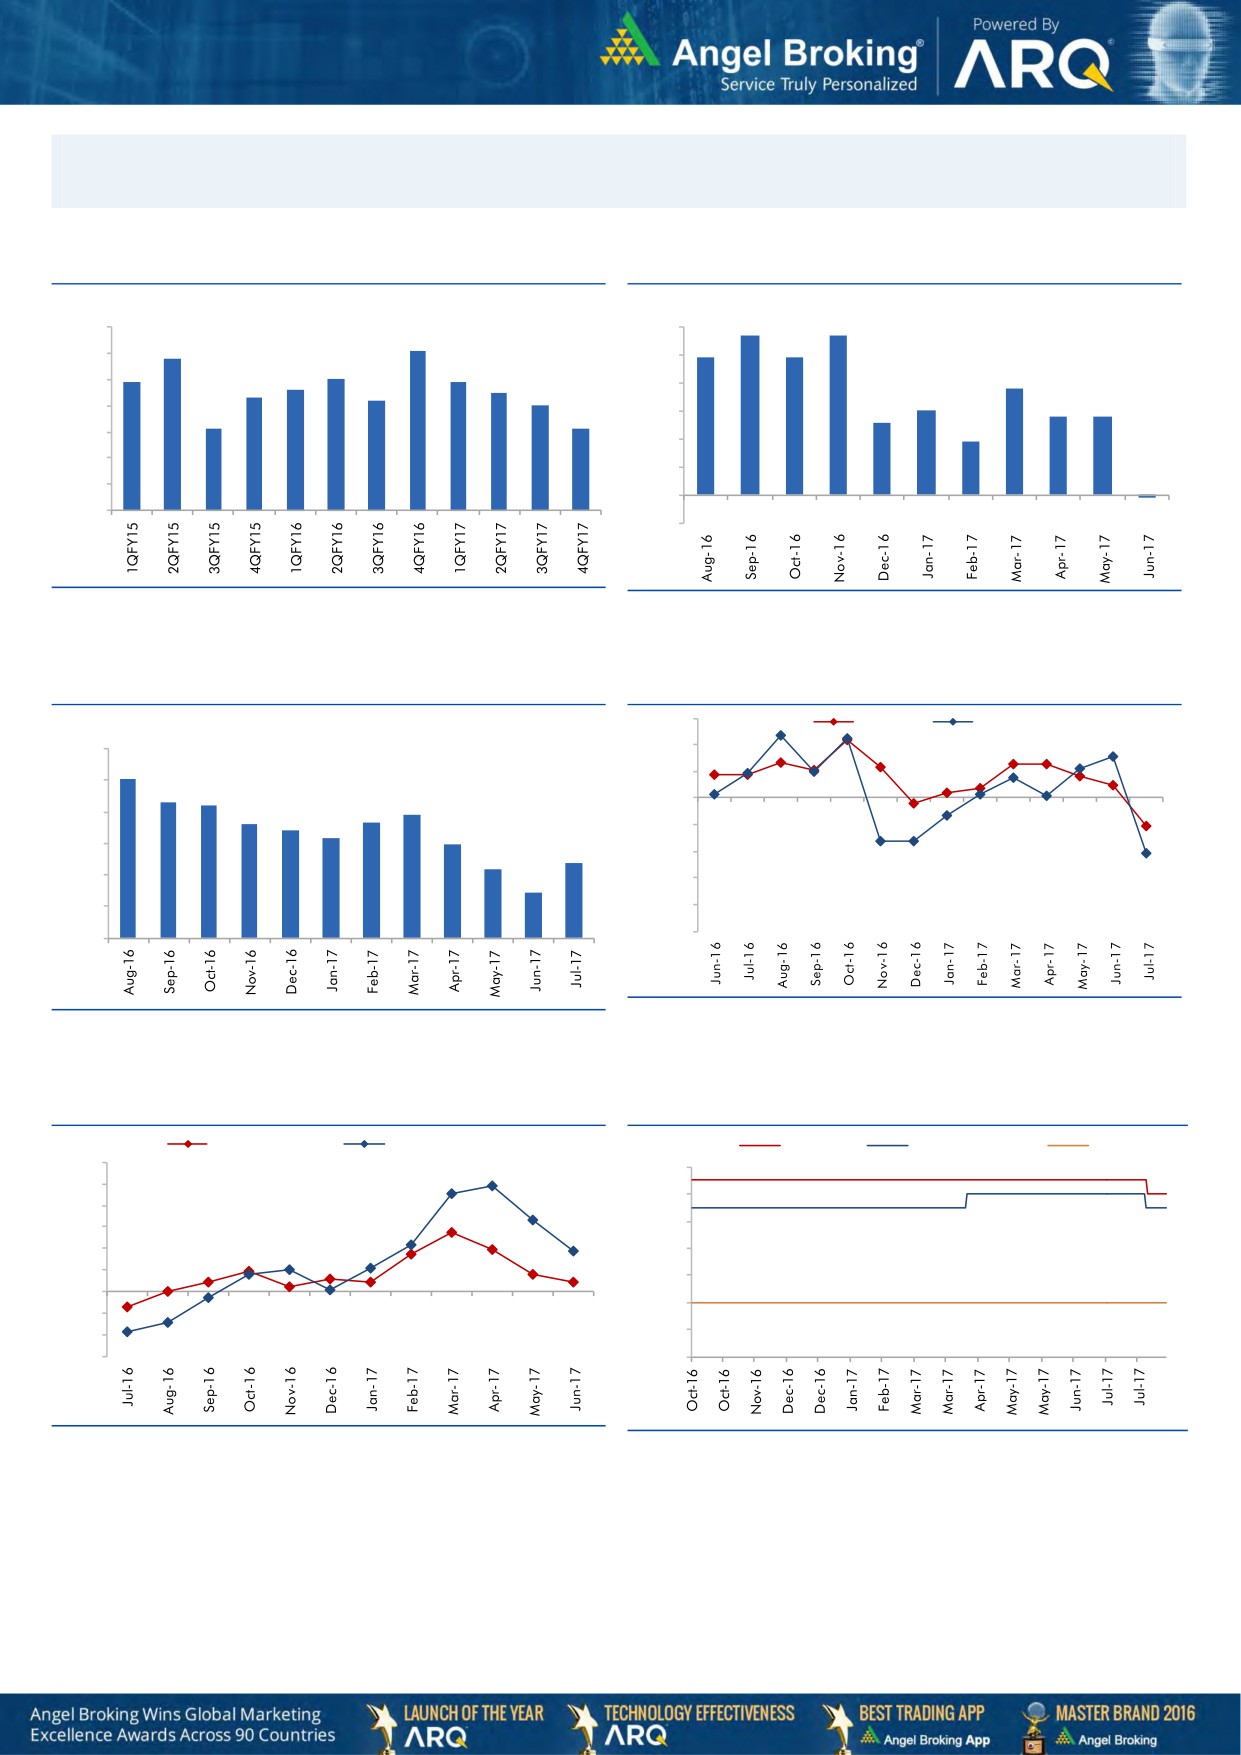
Macro watch
Exhibit 1: Quarterly GDP trends
Exhibit 2: IIP trends
(%)
(%)
5.7
5.7
10.0
6.0
9.1
8.8
4.9
4.9
9.0
5.0
7.9
8.0
7.9
7.6
7.5
3.8
8.0
7.3
7.2
4.0
7.0
3.0
2.6
2.8
2.8
7.0
6.1
6.1
3.0
1.9
6.0
2.0
5.0
1.0
4.0
-
3.0
(0.1)
(1.0)
Source: CSO, Angel Research
Source: MOSPI, Angel Research
Exhibit 3: Monthly CPI inflation trends
Exhibit 4: Manufacturing and services PMI
56.0
Mfg. PMI
Services PMI
(%)
6.0
54.0
5.1
52.0
5.0
4.3
4.2
3.9
50.0
3.6
3.7
4.0
3.4
3.2
3.0
48.0
3.0
2.4
2.2
46.0
2.0
1.5
44.0
1.0
42.0
40.0
-
Source: Market, Angel Research; Note: Level above 50 indicates expansion
Source: MOSPI, Angel Research
Exhibit 5: Exports and imports growth trends
Exhibit 6: Key policy rates
(%)
Exports yoy growth
Imports yoy growth
(%)
Repo rate
Reverse Repo rate
CRR
60.0
6.50
50.0
6.00
40.0
5.50
30.0
20.0
5.00
10.0
4.50
0.0
4.00
(10.0)
3.50
(20.0)
(30.0)
3.00
Source: Bloomberg, Angel Research
Source: RBI, Angel Research
Market Outlook
August 23, 2017
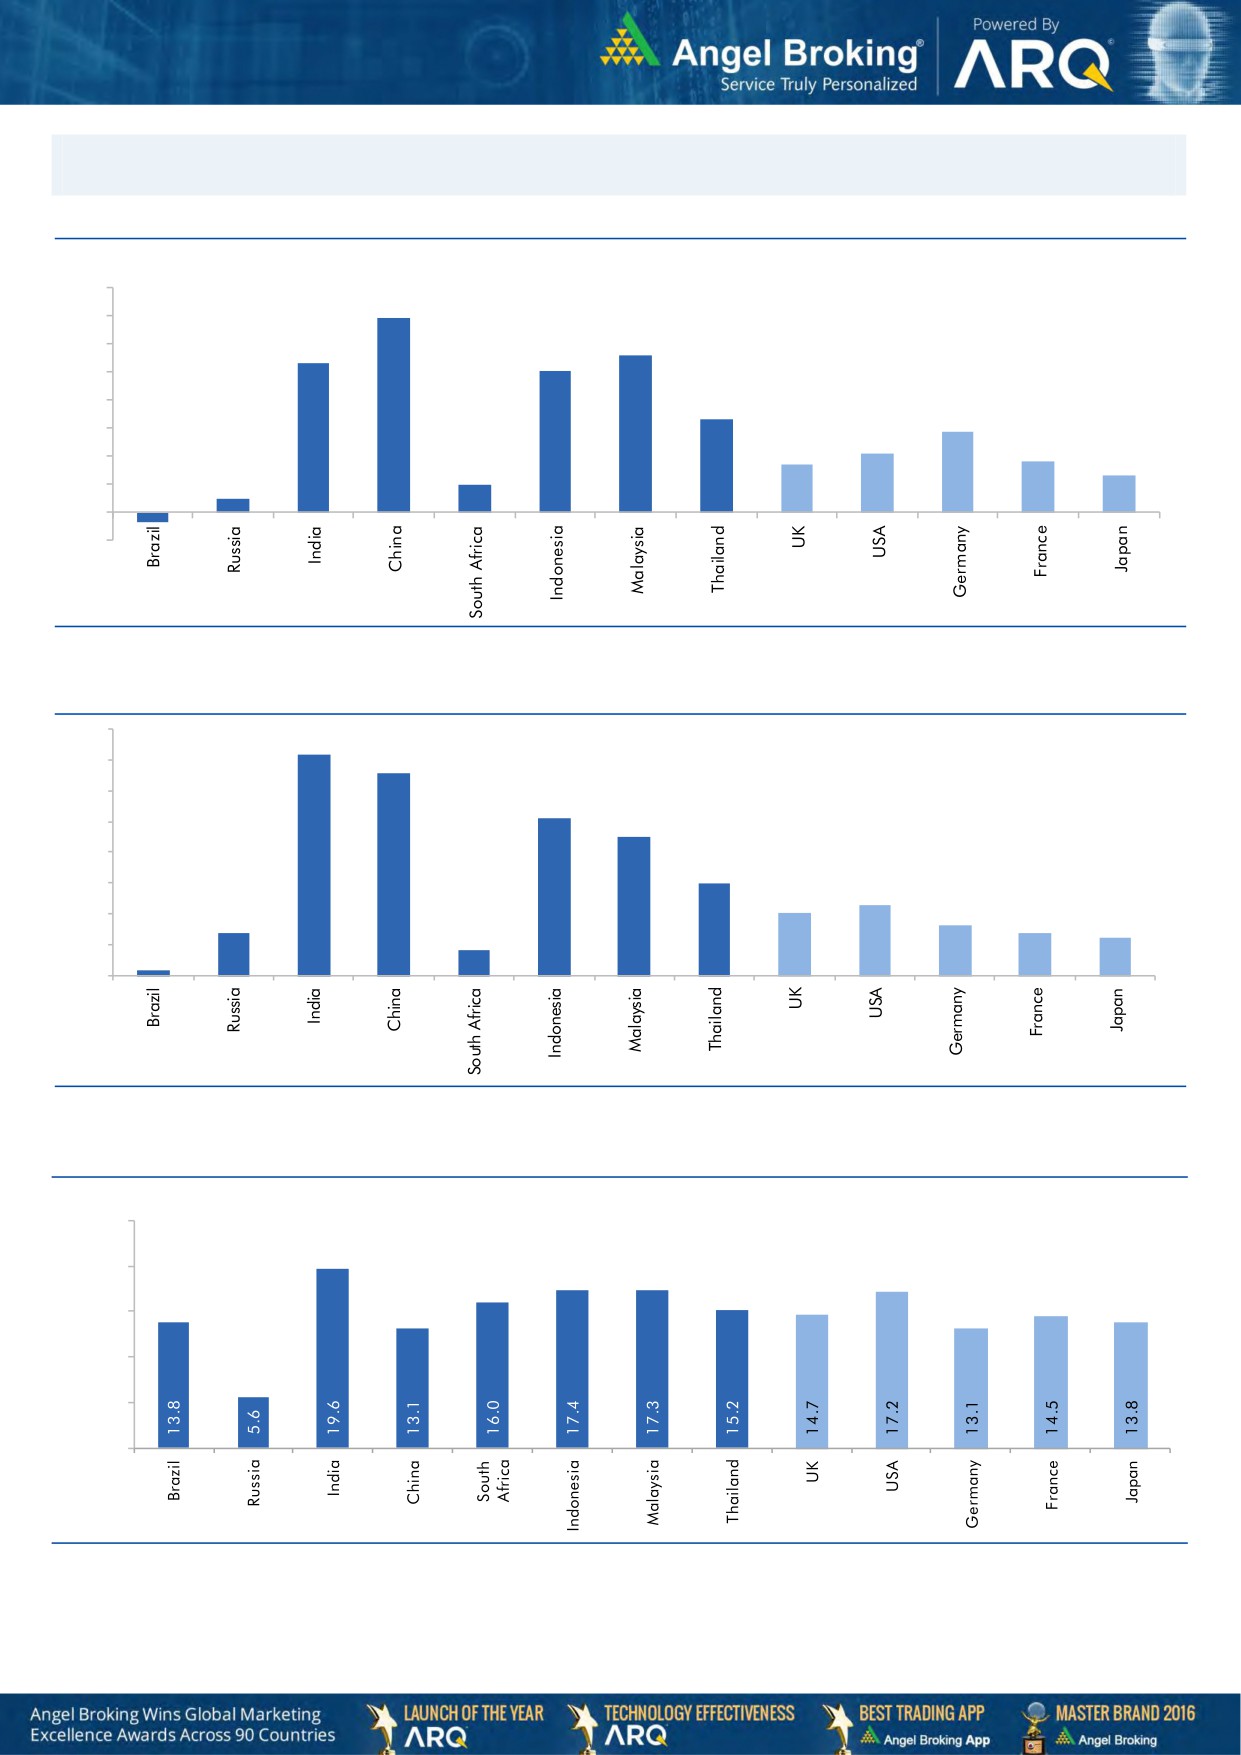
Global watch
Exhibit 1: Latest quarterly GDP Growth (%, yoy) across select developing and developed countries
(%)
8.0
6.9
7.0
5.6
6.0
5.3
5.0
1.0
5.0
4.0
3.3
2.9
3.0
2.1
1.7
1.8
0.5
2.0
1.3
1.0
-
(1.0)
(0.4)
Source: Bloomberg, Angel Research
Exhibit 2: 2016 GDP Growth projection by IMF (%, yoy) across select developing and developed countries
(%)
7.2
7.0
6.6
6.0
5.1
5.0
4.5
4.0
3.0
3.0
2.3
2.0
1.4
1.6
2.0
1.4
1.2
0.2
0.8
1.0
-
Source: IMF, Angel Research
Exhibit 3: One year forward P-E ratio across select developing and developed countries
(x)
25.0
20.0
15.0
10.0
5.0
-
Source: IMF, Angel Research
Market Outlook
August 23, 2017
Exhibit 4: Relative performance of indices across globe
Returns (%)
C ountry
Name of index
Closing price
1M
3M
1YR
Brazil
Bovespa
70,011
8.2
11.7
18.3
Russia
Micex
1,947
1.2
(0.7)
(1.8)
India
Nifty
9,766
(1.1)
3.5
13.2
China
Shanghai Composite
3,290
1.1
7.4
9.5
South Africa
Top 40
49,588
3.5
3.3
8.1
Mexico
Mexbol
51,333
(0.4)
3.7
7.7
Indonesia
LQ45
981
2.0
3.8
4.4
Malaysia
KLCI
1,774
0.9
0.3
5.0
Thailand
SET 50
1,002
0.2
2.0
2.0
USA
Dow Jones
21,900
1.5
4.8
18.1
UK
FTSE
7,382
(1.0)
(1.4)
8.0
Japan
Nikkei
19,384
(3.8)
(1.5)
14.9
Germany
DAX
12,229
(0.1)
(3.4)
15.5
France
CAC
5,132
0.3
(3.9)
15.1
Source: Bloomberg, Angel Research
Stock Watch
August 23, 2017
Company Name
Reco
CMP
Target
Mkt Cap
Sales ( Čcr )
OPM(%)
EPS (Č)
PER(x)
P/BV(x)
RoE(%)
EV/Sales(x)
(Č)
Price ( Č)
( Č cr )
FY18E FY19E
FY18E
FY19E
FY18E
FY19E
FY18E
FY19E
FY18E
FY19E
FY18E
FY19E
FY18E
FY19E
Agri / Agri Chemical
Rallis
Reduce
227
209
4,413
1,873
2,099
15.0
15.0
9.5
10.5
23.9
21.6
3.6
3.3
15.8
16.0
2.3
2.0
United Phosphorus
Neutral
798
-
40,554
18,922
21,949
18.0
18.5
36.2
45.6
22.1
17.5
4.6
3.8
22.7
23.8
2.3
1.9
Auto & Auto Ancillary
Ashok Leyland
Buy
100
124
29,368
23,339
27,240
10.1
10.8
4.7
6.2
21.6
16.1
4.3
3.8
20.0
23.6
1.2
1.0
Bajaj Auto
Accumulate
2,741
3,151
79,301
23,936
27,955
19.5
20.1
142.7
167.3
19.2
16.4
4.2
3.7
21.8
22.8
2.9
2.4
Bharat Forge
Neutral
1,139
-
26,508
7,637
8,755
21.7
23.2
36.1
47.3
31.6
24.1
5.7
4.8
18.5
20.8
3.3
2.8
Eicher Motors
Neutral
30,977
-
84,326
19,043
22,837
19.5
19.9
835.4
1,019.0
37.1
30.4
13.9
10.7
40.9
37.8
4.3
3.5
Gabriel India
Neutral
168
-
2,410
1,782
2,033
9.7
10.2
7.1
8.9
23.6
19.0
4.8
4.0
21.0
22.2
1.3
1.1
Hero Motocorp
Accumulate
3,885
4,129
77,588
32,239
36,878
16.0
15.6
184.4
206.5
21.1
18.8
6.6
5.8
31.3
30.7
2.2
1.9
Jamna Auto Industries Neutral
241
-
1,924
1,441
1,662
14.4
14.8
13.9
17.6
17.4
13.7
4.7
3.8
30.0
31.0
1.3
1.1
Mahindra and Mahindra Neutral
1,375
-
85,375
46,971
53,816
13.6
14.0
67.7
79.8
20.3
17.2
2.9
2.6
15.0
15.9
1.7
1.4
Maruti
Accumulate
7,498
8,544
226,513
81,825
101,245
15.0
15.0
283.5
356.0
26.5
21.1
5.8
4.7
21.9
22.4
2.4
1.9
Minda Industries
Neutral
773
-
6,684
4,328
5,084
11.0
11.9
27.3
36.4
28.4
21.3
6.0
4.7
23.1
25.6
1.6
1.4
Motherson Sumi
Neutral
311
-
65,460
55,937
64,445
10.8
11.4
16.9
21.1
18.4
14.8
4.1
4.2
25.2
25.4
1.2
1.0
Tata Motors
Neutral
373
-
107,799
303,167
343,649
11.8
13.8
33.1
54.7
11.3
6.8
1.8
1.5
16.9
23.0
0.4
0.3
TVS Motor
Neutral
582
-
27,662
13,992
16,216
9.0
9.4
17.1
20.3
34.2
28.7
9.1
7.0
29.7
27.7
1.9
1.6
Amara Raja Batteries
Accumulate
759
858
12,957
6,140
7,122
14.3
15.6
29.3
39.0
25.9
19.5
4.4
3.7
17.1
19.0
2.1
1.8
Exide Industries
Neutral
197
-
16,762
8,689
9,854
15.1
15.2
9.7
11.0
20.4
17.9
3.6
3.2
15.7
16.1
1.7
1.4
Apollo Tyres
Neutral
260
-
13,230
15,739
17,326
13.3
14.6
20.4
26.7
12.7
9.7
1.5
1.4
20.4
26.7
1.1
1.0
Ceat
Neutral
1,628
-
6,586
6,661
7,717
11.1
14.2
116.2
178.2
14.0
9.1
2.4
2.0
15.2
21.3
1.1
0.9
JK Tyres
Neutral
141
-
3,199
8,318
9,239
16.2
16.4
21.0
27.5
6.7
5.1
1.3
1.1
19.1
20.4
0.8
0.7
Swaraj Engines
Neutral
1,965
-
2,441
788
889
16.4
16.5
71.6
81.0
27.5
24.3
7.9
7.4
29.6
31.0
2.8
2.4
Subros
Neutral
218
-
1,306
1,855
2,135
11.6
11.8
10.3
14.7
21.2
14.9
3.2
2.8
15.8
19.1
0.9
0.8
Capital Goods
BEML
Neutral
1,789
-
7,452
4,286
5,194
7.1
8.2
42.9
58.1
41.7
30.8
3.4
3.1
7.6
8.7
1.8
1.5
Bharat Electronics
Neutral
178
-
39,803
10,258
12,470
19.6
19.5
7.3
8.6
24.4
20.7
0.5
0.4
20.4
21.9
3.4
2.7
Voltas
Neutral
525
-
17,362
6,778
8,004
9.6
11.0
17.1
22.4
30.7
23.4
7.3
6.4
17.7
19.8
2.3
1.9
BHEL
Neutral
125
-
30,693
33,200
39,167
6.8
9.5
6.2
11.2
20.2
11.2
0.9
0.9
4.6
8.0
0.5
0.4
Blue Star
Neutral
731
-
6,998
5,101
5,997
6.0
7.0
17.9
26.6
40.8
27.5
8.7
7.9
21.9
29.0
1.4
1.2
CG Power and Industrial
Neutral
79
-
4,954
6,555
7,292
7.5
7.5
-
0.8
7,905.0
98.8
1.2
1.2
0.1
1.2
0.8
0.8
Solutions
Greaves Cotton
Neutral
145
-
3,537
1,778
1,993
14.7
15.1
8.1
9.1
17.9
15.9
4.0
3.8
21.8
23.6
1.8
1.6
Stock Watch
August 23, 2017
Company Name
Reco
CMP
Target
Mkt Cap
Sales ( Čcr )
OPM(%)
EPS (Č)
PER(x)
P/BV(x)
RoE(%)
EV/Sales(x)
(Č)
Price ( Č)
( Č cr )
FY18E FY19E
FY18E
FY19E
FY18E
FY19E
FY18E
FY19E
FY18E
FY19E
FY18E
FY19E
FY18E
FY19E
Capital Goods
KEC International
Neutral
297
-
7,638
9,779
11,113
9.4
9.8
14.2
18.2
20.9
16.3
4.0
3.3
21.1
22.1
1.0
0.9
KEI Industries
Buy
221
258
1,721
3,001
3,391
10.0
10.0
13.0
16.1
17.0
13.7
3.1
2.6
18.2
18.7
0.8
0.7
Thermax
Neutral
877
-
10,447
4,125
4,747
10.3
10.8
26.7
31.5
32.8
27.8
3.7
3.4
11.2
12.0
2.3
2.0
VATech Wabag
Accumulate
609
681
3,322
3,867
4,126
9.6
10.0
34.9
39.8
17.4
15.3
2.9
2.5
17.7
17.5
0.9
0.8
Cement
ACC
Neutral
1,788
-
33,581
12,255
13,350
13.5
14.3
58.0
66.2
30.8
27.0
3.7
3.4
11.5
12.2
2.7
2.5
Ambuja Cements
Neutral
273
-
54,198
10,250
11,450
17.5
19.0
7.2
8.3
37.9
32.9
2.7
2.6
7.0
7.8
5.1
4.5
India Cements
Neutral
174
-
5,370
6,135
6,750
14.8
15.2
8.5
11.5
20.5
15.2
1.0
1.0
4.8
6.2
1.2
1.1
JK Cement
Neutral
1,013
-
7,085
4,150
4,775
19.2
20.0
49.0
63.5
20.7
16.0
3.3
2.8
17.0
18.5
2.1
1.8
J K Lakshmi Cement
Neutral
412
-
4,853
3,422
3,757
15.5
17.0
13.5
23.2
30.6
17.8
3.2
2.7
10.8
15.5
1.8
1.6
Orient Cement
Neutral
150
-
3,076
2,215
3,233
16.8
17.0
5.9
6.9
25.5
21.8
1.9
1.8
10.8
10.1
2.4
1.6
UltraTech Cement
Neutral
3,975
-
109,123
28,250
35,150
20.2
23.5
77.5
122.2
51.3
32.5
4.3
3.9
9.6
14.8
4.3
3.5
Construction
KNR Constructions
Neutral
214
-
3,007
1,846
2,203
14.5
14.5
12.1
13.7
17.7
15.7
1.0
0.8
17.5
16.7
1.7
1.4
Larsen & Toubro
Neutral
1,119
-
156,756
95,787
109,476
10.2
11.6
44.5
50.8
25.2
22.1
3.2
2.9
12.9
13.1
2.2
1.9
Gujarat Pipavav Port
Neutral
133
-
6,410
739
842
61.6
62.7
5.1
6.2
26.0
21.6
3.2
3.2
12.7
14.9
8.1
7.0
PNC Infratech
Neutral
140
-
3,589
2,040
2,935
13.0
13.0
6.4
9.0
21.9
15.5
0.6
0.5
9.7
12.2
1.8
1.3
Simplex Infra
Neutral
488
-
2,415
6,012
6,619
11.6
11.7
21.1
31.0
23.2
15.8
1.6
1.5
6.5
8.6
0.9
0.8
Sadbhav Engineering
Accumulate
264
298
4,523
3,823
4,426
10.7
10.8
10.3
11.8
25.6
22.3
3.1
2.7
10.1
10.5
1.5
1.3
NBCC
Neutral
203
-
18,311
9,099
12,706
6.4
6.4
7.3
9.6
28.0
21.3
1.2
1.0
27.5
30.5
1.9
1.4
MEP Infra
Neutral
114
-
1,850
2,403
2,910
18.3
16.8
2.4
6.1
48.4
18.7
18.4
12.4
35.2
55.8
1.9
1.6
SIPL
Neutral
101
-
3,565
2,060
2,390
46.8
47.7
(5.8)
(3.1)
3.8
4.3
(14.2)
(2.3)
6.5
6.1
Engineers India
Neutral
150
-
10,095
1,795
2,611
21.1
22.4
5.9
8.1
25.4
18.5
1.8
1.8
12.9
16.1
4.0
2.6
Financials
Axis Bank
Buy
499
580
119,665
32,558
35,843
3.5
3.2
27.8
41.0
18.0
12.2
1.9
1.7
11.4
14.9
-
-
Bank of Baroda
Neutral
139
-
32,120
22,533
26,079
2.4
2.4
12.0
20.9
11.6
6.7
0.8
0.7
6.6
11.0
-
-
Canara Bank
Neutral
327
-
19,525
17,925
20,235
2.0
2.1
18.5
36.5
17.7
9.0
0.7
0.6
3.4
6.2
-
-
Can Fin Homes
Neutral
2,704
-
7,197
586
741
3.5
3.5
107.8
141.0
25.1
19.2
5.5
4.4
24.1
25.6
-
-
Cholamandalam Inv. &
Accumulate
1,142
1,230
17,848
2,826
3,307
6.3
6.3
53.7
64.6
21.3
17.7
3.6
3.1
18.3
18.9
-
-
Fin. Co.
Dewan Housing Finance Accumulate
456
520
14,292
2,676
3,383
2.4
2.7
37.4
49.7
12.2
9.2
1.6
1.4
13.8
16.2
-
-
Equitas Holdings
Buy
155
235
5,265
1,125
1,380
9.6
9.8
1.5
6.0
103.6
25.9
2.4
2.2
2.4
8.2
-
-
Federal Bank
Buy
105
125
20,486
4,896
5,930
2.8
3.1
5.4
7.6
19.6
13.9
1.7
1.5
8.5
11.0
-
-
Stock Watch
August 23, 2017
Company Name
Reco
CMP
Target
Mkt Cap
Sales ( Čcr )
OPM(%)
EPS (Č)
PER(x)
P/BV(x)
RoE(%)
EV/Sales(x)
(Č)
Price ( Č)
( Č cr )
FY18E FY19E
FY18E
FY19E
FY18E
FY19E
FY18E
FY19E
FY18E
FY19E
FY18E
FY19E
FY18E
FY19E
Financials
HDFC Bank
Neutral
1,750
-
450,753
55,236
63,253
4.5
4.4
68.9
82.4
25.4
21.2
4.4
3.7
18.7
18.5
-
-
ICICI Bank
Accumulate
293
315
188,235
42,361
51,378
3.6
3.9
18.4
25.7
16.0
11.4
1.7
1.7
11.3
15.0
-
-
Karur Vysya Bank
Buy
136
160
8,225
3,289
3,630
3.7
3.9
10.8
14.1
12.6
9.7
1.5
1.3
12.5
14.7
-
-
LIC Housing Finance
Neutral
637
-
32,145
4,895
6,332
3.4
3.7
50.7
66.8
12.6
9.5
2.5
2.1
21.7
23.8
-
-
Punjab Natl.Bank
Neutral
138
-
29,345
23,708
25,758
2.1
2.1
5.9
16.4
23.5
8.4
0.7
0.7
3.0
8.3
-
-
RBL Bank
Neutral
502
-
19,028
2,309
2,888
2.6
2.5
16.4
19.1
30.7
26.3
3.9
3.4
13.3
13.8
-
-
Repco Home Finance
Buy
632
825
3,951
496
597
4.4
4.2
38.5
48.7
16.4
13.0
3.0
2.4
19.6
20.6
-
-
South Ind.Bank
Neutral
27
-
4,800
3,195
3,567
3.0
3.1
3.0
3.8
8.8
6.9
0.9
0.8
10.5
11.9
-
-
St Bk of India
Neutral
274
-
236,605
105,827
121,056
2.4
2.5
16.1
25.6
17.0
10.7
1.3
1.2
6.6
9.9
-
-
Union Bank
Neutral
129
-
8,885
14,650
16,225
2.3
2.3
23.1
32.5
5.6
4.0
0.4
0.4
7.1
9.2
-
-
Yes Bank
Neutral
1,713
-
78,408
11,088
13,138
3.0
2.9
84.0
99.3
20.4
17.3
3.1
2.7
16.3
16.8
-
-
FMCG
Akzo Nobel India
Neutral
1,749
-
8,389
3,164
3,607
13.8
13.7
58.6
67.9
29.9
25.8
7.3
6.5
24.5
25.1
2.5
2.2
Asian Paints
Neutral
1,130
-
108,375
17,603
20,615
18.6
18.6
2,128.9
2,543.3
0.5
0.4
11.2
9.4
28.0
28.9
6.0
5.0
Britannia
Neutral
4,200
-
50,420
9,690
11,278
14.8
15.4
84.0
101.0
50.0
41.6
18.2
14.5
40.6
39.0
5.2
4.4
Colgate
Neutral
1,083
-
29,467
4,420
5,074
24.9
25.3
28.6
32.8
37.9
33.0
14.9
12.1
43.8
40.5
6.4
5.5
Dabur India
Neutral
301
-
53,013
8,346
9,344
19.6
19.9
7.8
9.0
38.6
33.4
7.8
7.0
25.2
24.8
6.0
5.2
GlaxoSmith Con*
Neutral
5,359
-
22,536
5,072
5,760
18.2
18.4
176.3
199.2
30.4
26.9
6.5
5.8
21.2
21.7
3.8
3.3
Godrej Consumer
Neutral
888
-
60,492
10,171
11,682
20.8
21.5
21.7
27.1
40.9
32.8
9.2
7.9
22.3
23.4
6.1
5.2
HUL
Neutral
1,201
-
259,898
37,077
41,508
20.3
21.8
5,189.9
6,318.5
0.2
0.2
36.6
31.3
74.8
82.0
6.9
6.1
ITC
Neutral
283
-
344,642
44,588
49,853
37.0
37.3
9.6
11.0
29.5
25.7
7.2
6.9
25.1
27.3
7.2
6.4
Marico
Neutral
315
-
40,624
6,788
7,766
18.5
19.2
7.1
8.5
44.3
37.0
15.5
13.3
36.9
38.0
5.8
5.1
Nestle*
Neutral
6,619
-
63,815
10,083
11,182
20.0
20.9
119.7
141.3
55.3
46.8
194.9
178.1
36.7
39.8
6.0
5.4
Tata Global
Neutral
190
-
11,982
7,121
7,641
11.9
12.3
6.9
8.0
27.5
23.7
1.8
1.8
6.8
7.2
1.5
1.4
Procter & Gamble
Neutral
8,115
-
26,342
3,034
3,579
27.1
27.7
167.7
198.8
48.4
40.8
13.0
11.2
28.8
29.5
8.1
6.8
Hygiene
IT
HCL Tech^
Buy
875
1,014
124,869
52,342
57,053
20.9
20.9
62.8
67.6
13.9
12.9
3.1
2.7
22.4
20.6
2.1
1.8
Infosys
Buy
877
1,179
201,478
73,963
80,619
26.0
26.0
64.4
69.3
13.6
12.7
2.7
2.5
19.7
19.6
2.2
1.9
TCS
Accumulate
2,496
2,651
491,829
127,403
138,870
27.6
27.6
144.5
156.0
17.3
16.0
5.1
4.8
29.7
29.8
3.5
3.2
Tech Mahindra
Buy
439
533
42,844
31,015
33,496
15.0
15.0
35.6
38.1
12.3
11.5
2.1
2.0
17.0
16.3
1.2
1.0
Wipro
Neutral
290
-
141,249
58,536
61,858
20.3
20.3
18.2
19.1
16.0
15.2
2.5
2.2
14.6
13.4
2.3
2.2
Stock Watch
August 23, 2017
Company Name
Reco
CMP
Target
Mkt Cap
Sales ( Čcr )
OPM(%)
EPS (Č)
PER(x)
P/BV(x)
RoE(%)
EV/Sales(x)
(Č)
Price ( Č)
( Č cr )
FY18E FY19E
FY18E
FY19E
FY18E
FY19E
FY18E
FY19E
FY18E
FY19E
FY18E
FY19E
FY18E
FY19E
Media
D B Corp
Neutral
380
-
6,985
2,404
2,625
30.5
31.5
23.7
26.9
16.0
14.1
3.8
3.2
23.5
22.8
2.7
2.5
HT Media
Neutral
92
-
2,138
2,589
2,830
15.1
15.4
8.3
10.9
11.1
8.4
0.9
0.8
8.4
10.4
0.4
0.2
Jagran Prakashan
Buy
176
225
5,742
2,541
2,835
28.5
28.7
12.7
14.1
13.8
12.5
2.9
2.5
21.3
21.4
2.1
1.8
Sun TV Network
Neutral
698
-
27,513
3,238
3,789
51.9
55.1
30.9
38.0
22.6
18.4
6.4
5.7
30.0
31.0
8.0
6.7
Hindustan Media
Neutral
266
-
1,954
1,002
1,074
23.3
23.5
29.2
33.8
9.1
7.9
1.4
1.2
15.6
15.4
1.0
0.7
Ventures
TV Today Network
Buy
242
344
1,444
667
727
27.7
27.7
18.6
20.1
13.0
12.1
2.0
2.1
15.6
17.3
1.7
1.6
Music Broadcast Limited Buy
367
434
2,094
271
317
91.0
109.0
6.0
10.0
61.2
36.7
3.8
3.5
6.5
9.3
7.3
6.0
Metals & Mining
Coal India
Neutral
240
-
149,009
82,301
91,235
17.0
18.0
17.1
20.5
14.0
11.7
2.6
2.5
45.0
55.0
1.5
1.3
Hind. Zinc
Neutral
287
-
121,351
22,108
24,555
57.0
58.0
22.1
26.3
13.0
10.9
4.2
3.4
32.0
35.0
4.5
3.7
Hindalco
Neutral
228
-
51,231
102,350
105,355
13.5
14.5
21.5
24.5
10.6
9.3
1.5
1.2
15.0
15.2
1.1
1.0
JSW Steel
Neutral
232
-
56,080
64,500
68,245
21.1
21.5
20.1
21.2
11.5
10.9
2.1
1.8
-
-
1.6
1.5
NMDC
Neutral
122
-
38,552
10,209
11,450
47.0
48.0
11.1
12.1
11.0
10.1
1.5
1.4
-
-
3.3
3.0
SAIL
Neutral
59
-
24,285
54,100
63,555
3.0
10.0
(10.0)
1.5
39.2
0.8
0.8
-
-
1.4
1.2
Vedanta
Neutral
293
-
108,932
81,206
87,345
28.0
29.0
26.5
33.5
11.1
8.8
2.5
2.2
-
-
2.1
1.8
Tata Steel
Neutral
619
-
60,147
121,445
126,500
16.2
17.2
65.4
81.3
9.5
7.6
1.5
1.3
-
-
1.0
0.9
Oil & Gas
GAIL
Neutral
377
-
63,694
53,115
52,344
14.2
15.3
30.0
31.1
12.6
12.1
1.6
1.4
-
-
0.9
0.9
ONGC
Neutral
159
-
204,434
83,111
84,934
44.2
44.9
16.4
16.9
9.7
9.4
1.2
1.1
-
-
2.3
2.3
Indian Oil Corp
Neutral
423
-
205,502
396,116
432,560
8.5
8.8
40.1
42.2
10.6
10.0
1.8
1.6
-
-
0.7
0.6
Reliance Industries
Neutral
1,563
-
508,386
257,711
267,438
17.0
18.2
89.1
89.5
17.6
17.5
1.6
1.5
-
-
1.6
1.6
Pharmaceuticals
Alembic Pharma
Buy
512
600
9,650
3,903
4,584
18.2
19.2
21.8
27.2
23.5
18.8
4.3
3.6
19.8
20.6
2.5
2.1
Alkem Laboratories Ltd
Buy
1,755
2,161
20,985
6,901
7,850
18.4
19.1
85.0
100.5
20.7
17.5
4.2
3.5
20.2
20.1
3.0
2.7
Aurobindo Pharma
Buy
695
823
40,745
17,086
19,478
22.1
22.0
44.7
51.4
15.6
13.5
3.4
2.8
24.7
22.7
2.5
2.2
Aventis*
Neutral
3,990
-
9,190
2,508
2,862
16.8
16.8
139.9
153.8
28.5
26.0
4.1
3.4
23.5
25.8
3.3
2.7
Cadila Healthcare
Reduce
468
426
47,952
11,584
13,228
20.3
20.4
18.7
21.3
25.1
22.0
5.6
4.6
24.6
22.9
4.0
3.4
Cipla
Sell
559
461
44,994
16,619
19,437
15.4
16.2
19.7
24.3
28.4
23.0
3.2
2.9
12.0
13.2
2.9
2.4
Dr Reddy's
Buy
1,985
2,419
32,900
15,844
17,973
17.6
18.2
91.7
111.0
21.7
17.9
2.5
2.2
11.9
13.0
2.3
2.0
GSK Pharma*
Neutral
2,356
-
19,955
3,260
3,651
15.0
18.0
46.1
58.6
51.1
40.2
10.5
10.8
20.0
26.5
6.0
5.5
Indoco Remedies
Sell
192
153
1,765
1,154
1,310
14.9
14.9
11.3
12.7
17.0
15.1
2.4
2.1
15.0
15.0
1.7
1.4
Ipca labs
Buy
410
620
5,171
3,593
4,022
14.5
15.5
19.4
25.2
21.1
16.3
1.9
1.7
9.5
11.2
1.5
1.3
Stock Watch
August 23, 2017
Company Name
Reco
CMP
Target
Mkt Cap
Sales ( Čcr )
OPM(%)
EPS (Č)
PER(x)
P/BV(x)
RoE(%)
EV/Sales(x)
(Č)
Price ( Č)
( Č cr )
FY18E FY19E
FY18E
FY19E
FY18E
FY19E
FY18E
FY19E
FY18E
FY19E
FY18E
FY19E
FY18E
FY19E
Pharmaceuticals
Lupin
Buy
944
1,467
42,656
18,657
21,289
21.3
23.3
52.8
66.7
17.9
14.2
2.7
2.3
16.3
17.5
2.3
1.9
Natco Pharma
Accumulate
736
796
12,833
1,836
1,946
31.8
28.9
22.1
20.6
33.3
35.7
6.7
6.0
20.1
16.7
6.8
6.4
Sun Pharma
Buy
471
712
112,969
32,899
36,451
26.9
25.4
31.6
32.3
14.9
14.6
2.6
2.3
18.7
18.8
3.1
2.6
Syngene International
Buy
442
557
8,836
1,402
1,823
32.8
36.0
15.9
20.7
27.8
21.4
5.2
4.3
18.7
20.0
6.3
4.8
Power
Tata Power
Neutral
80
-
21,652
32,547
33,806
20.5
20.5
4.7
5.4
17.0
15.0
1.6
1.4
10.5
10.5
1.7
1.6
NTPC
Neutral
167
-
138,070
86,070
101,246
28.3
30.7
12.9
16.2
13.0
10.3
1.3
1.2
10.6
12.4
3.0
2.7
Power Grid
Neutral
219
-
114,807
29,183
32,946
89.7
90.0
18.0
20.8
12.2
10.6
2.0
1.8
17.7
18.2
7.9
7.3
Real Estate
Prestige Estate
Neutral
258
-
9,683
4,607
5,146
21.0
22.2
7.9
9.8
32.7
26.4
2.0
1.9
10.3
12.0
3.3
3.0
MLIFE
Buy
414
522
2,125
487
590
12.3
17.8
21.0
31.2
19.7
13.3
1.0
1.0
5.2
7.4
3.1
2.5
Telecom
Bharti Airtel
Neutral
422
-
168,550
97,903
105,233
36.0
36.3
9.3
11.1
45.3
38.2
2.2
2.1
5.0
5.6
2.7
2.4
Idea Cellular
Neutral
88
-
31,702
35,012
37,689
27.1
27.7
(4.4)
(2.7)
1.4
1.4
(6.8)
(4.6)
2.2
2.0
zOthers
Abbott India
Neutral
4,300
-
9,137
3,244
3,723
14.9
16.1
167.5
209.4
25.7
20.5
5.7
4.7
23.7
24.8
2.5
2.1
Asian Granito
Buy
408
480
1,228
1,169
1,286
12.5
12.5
16.0
19.7
25.6
20.7
2.7
2.4
10.7
11.6
1.3
1.1
Bajaj Electricals
Buy
334
395
3,384
4,646
5,301
6.7
7.6
16.1
22.3
20.7
15.0
3.4
2.9
16.4
19.2
0.7
0.6
Banco Products (India)
Neutral
203
-
1,454
1,530
1,695
13.2
12.7
19.0
20.0
10.7
10.2
1.7
1.5
0.2
0.2
0.9
95.3
Coffee Day Enterprises
Neutral
242
-
4,985
3,494
3,913
17.4
18.0
4.8
5.7
-
42.5
2.1
2.0
-
0.1
1.9
1.7
Ltd
Elecon Engineering
Neutral
48
-
535
171
201
15.0
16.2
36.0
43.0
1.3
1.1
0.1
0.1
0.1
0.1
2.5
2.1
Garware Wall Ropes
Neutral
856
-
1,874
928
1,003
15.2
15.2
39.4
43.2
21.7
19.8
3.6
3.1
16.5
15.4
1.9
1.7
Goodyear India*
Neutral
806
-
1,860
1,717
1,866
11.8
12.3
47.9
49.8
16.8
16.2
2.6
2.3
15.6
15.7
0.8
111.4
Hitachi
Neutral
1,999
-
5,437
2,355
2,715
10.3
10.8
49.0
60.9
40.8
32.8
9.6
7.6
0.2
0.2
2.3
2.0
HSIL
Neutral
360
-
2,602
2,240
2,670
14.6
15.0
17.0
22.0
21.2
16.4
1.7
1.7
0.1
0.1
1.4
1.1
Interglobe Aviation
Neutral
1,229
-
44,440
22,570
27,955
14.2
15.0
63.6
81.8
19.3
15.0
10.2
8.6
0.5
0.6
1.7
1.3
Jyothy Laboratories
Neutral
374
-
6,797
1,781
2,044
14.1
15.0
9.4
10.5
40.0
35.6
8.5
8.0
0.2
0.2
4.0
3.4
Linc Pen & Plastics
Neutral
244
-
361
420
462
9.3
9.3
15.3
17.1
16.0
14.3
2.7
2.8
16.9
19.5
0.9
0.8
M M Forgings
Neutral
608
-
733
542
642
20.1
21.0
41.6
56.8
14.6
10.7
2.0
1.7
0.1
0.2
1.8
1.6
Mirza International
Neutral
153
-
1,835
1,148
1,285
18.0
18.0
8.0
9.4
19.0
16.3
3.1
2.7
16.3
16.1
1.8
1.5
Navkar Corporation
Buy
183
265
2,612
561
617
41.5
41.5
11.5
12.7
15.9
14.4
1.7
1.5
10.5
10.4
5.3
4.6
Nilkamal
Neutral
1,561
-
2,330
2,317
2,525
11.4
11.1
96.0
105.0
16.3
14.9
2.8
2.4
0.2
0.2
1.0
0.9
Parag Milk Foods
Neutral
238
-
1,998
1,987
2,379
7.6
9.0
12.4
18.3
19.2
13.0
2.7
2.4
8.2
13.2
1.1
1.0
Stock Watch
August 23, 2017
Company Name
Reco
CMP
Target Mkt Cap
Sales ( Čcr )
OPM(%)
EPS (Č)
PER(x)
P/BV(x)
RoE(%)
EV/Sales(x)
(Č)
Price ( Č)
( Č cr )
FY18E FY19E FY18E FY19E FY18E FY19E FY18E FY19E FY18E FY19E FY18E FY19E FY18E FY19E
zOthers
Radico Khaitan
Neutral
163
-
2,164
1,811
1,992
13.2
13.2
8.1
8.8
20.1
18.5
2.0
2.2
10.1
12.0
1.5
1.4
Relaxo Footwears
Neutral
492
-
5,910
1,981
2,310
13.7
14.5
12.0
15.5
41.0
31.7
8.0
6.5
0.2
0.2
3.0
2.6
Siyaram Silk Mills
Buy
1,954
2,500
1,832
1,769
1,981
12.7
12.7
113.1
131.1
17.3
14.9
2.7
2.3
15.5
15.5
1.2
1.1
Styrolution ABS India* Neutral
897
-
1,577
1,800
1,980
8.0
8.1
42.0
46.2
21.4
19.4
2.4
2.1
0.1
0.1
1.0
0.9
Surya Roshni
Neutral
271
-
1,187
4,870
5,320
7.7
7.8
22.8
28.1
11.9
9.6
1.6
1.4
0.1
0.1
0.5
0.4
TVS Srichakra
Neutral
3,342
-
2,559
2,729
2,893
12.7
12.5
248.5
265.0
13.5
12.6
3.8
3.1
0.3
0.3
0.9
0.9
Visaka Industries
Neutral
514
-
816
1,104
1,214
12.1
12.6
31.0
37.9
16.6
13.6
2.0
1.8
0.1
0.1
1.0
0.9
VIP Industries
Neutral
208
-
2,944
1,450
1,693
10.4
10.5
6.5
7.8
31.8
26.7
6.7
5.9
21.1
22.1
2.0
1.7
Navin Fluorine
Accumulate
658
730
3,240
945
1,154
22.4
22.6
28.7
34.8
22.9
18.9
3.8
3.2
-
-
2.9
2.3
Source: Company, Angel Research; Note: *December year end; #September year end; &October year end; Price as on August 22, 2017
Market Outlook
August 23, 2017
Research Team Tel: 022 - 39357800
DISCLAIMER
Angel Broking Private Limited (hereinafter referred to as “Angel”) is a registered Member of National Stock Exchange of India
Limited,Bombay Stock Exchange Limited and Metropolitan Stock Exchange Limited. It is also registered as a Depository Participant with
CDSL and Portfolio Manager with SEBI. It also has registration with AMFI as a Mutual Fund Distributor. Angel Broking Private Limited is a
registered entity with SEBI for Research Analyst in terms of SEBI (Research Analyst) Regulations, 2014 vide registration number
INH000000164. Angel or its associates has not been debarred/ suspended by SEBI or any other regulatory authority for accessing
/dealing in securities Market. Angel or its associates/analyst has not received any compensation / managed or
co-managed public offering of securities of the company covered by Analyst during the past twelve months.
This document is solely for the personal information of the recipient, and must not be singularly used as the basis of any investment
decision. Nothing in this document should be construed as investment or financial advice. Each recipient of this document should make
such investigations as they deem necessary to arrive at an independent evaluation of an investment in the securities of the companies
referred to in this document (including the merits and risks involved), and should consult their own advisors to determine the merits and
risks of such an investment.
Reports based on technical and derivative analysis center on studying charts of a stock's price movement, outstanding positions and
trading volume, as opposed to focusing on a company's fundamentals and, as such, may not match with a report on a company's
fundamentals. Investors are advised to refer the Fundamental and Technical Research Reports available on our website to evaluate the
contrary view, if any.
The information in this document has been printed on the basis of publicly available information, internal data and other reliable
sources believed to be true, but we do not represent that it is accurate or complete and it should not be relied on as such, as this
document is for general guidance only. Angel Broking Pvt. Limited or any of its affiliates/ group companies shall not be in any way
responsible for any loss or damage that may arise to any person from any inadvertent error in the information contained in this report.
Angel Broking Pvt. Limited has not independently verified all the information contained within this document. Accordingly, we cannot
testify, nor make any representation or warranty, express or implied, to the accuracy, contents or data contained within this document.
While Angel Broking Pvt. Limited endeavors to update on a reasonable basis the information discussed in this material, there may be
regulatory, compliance, or other reasons that prevent us from doing so.
This document is being supplied to you solely for your information, and its contents, information or data may not be reproduced,
redistributed or passed on, directly or indirectly.
Neither Angel Broking Pvt. Limited, nor its directors, employees or affiliates shall be liable for any loss or damage that may arise from
or in connection with the use of this information.